Text description of the Triennial In-Library Use Survey Infographic
The John Jay College Library distributes a paper survey every 3 years to visitors within the LIbrary. The survey poses a similar set of questions as a way to track changes in user opinion, behavior and expectations. With a decade of survey results now available, here we highlight some of the data that remains constant and some of the changes we've noticed over the four survey periods spanning from 2010-2019.
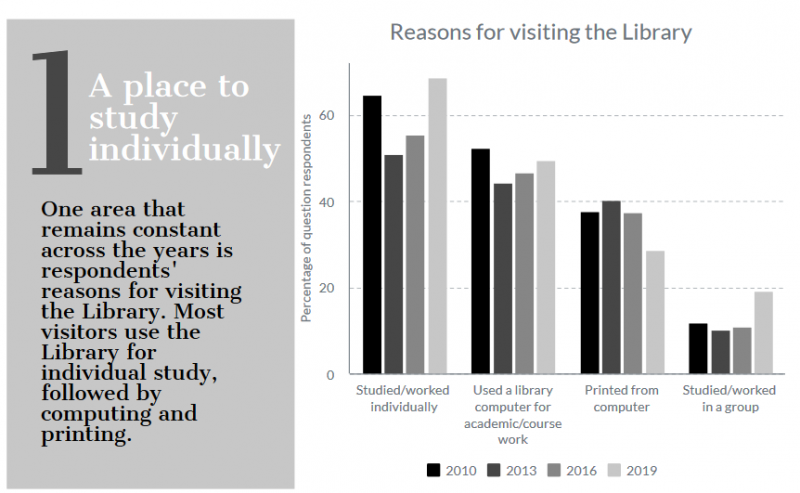
1. A place to study individually.
One area that remains constant across the years is respondents' reasons for visiting the Library. Most visitors use the Library for individual study, followed by computing and printing.
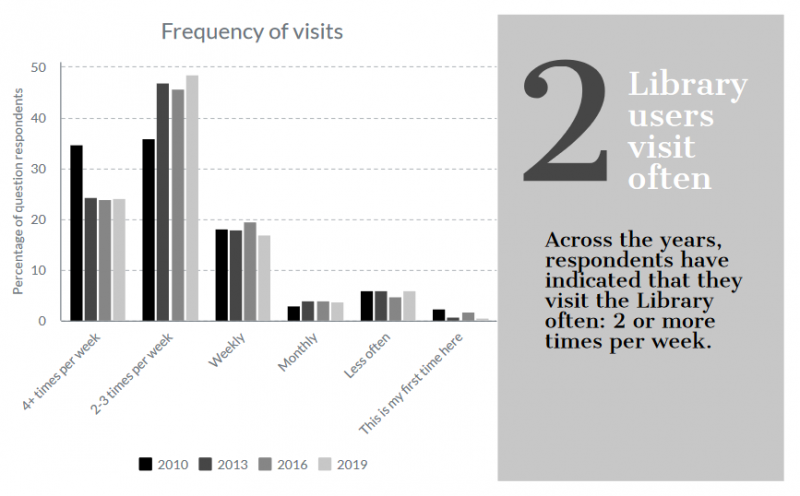
2. Library users visit often.
Across the years, respondents have indicated that they visit the Library often: 2 or more times per week.
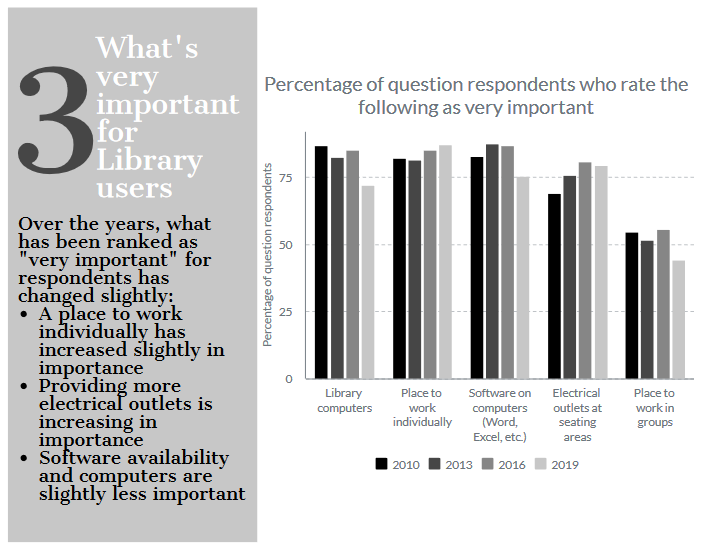
3. What's very important for Library users.
Over the years, what has been ranked as "very important" for respondents has changed slightly:
- A place to work individual has increased slightly in importance.
- Providing more electrical outlets is increasing in importance.
- Software availability and computers are slightly less important.
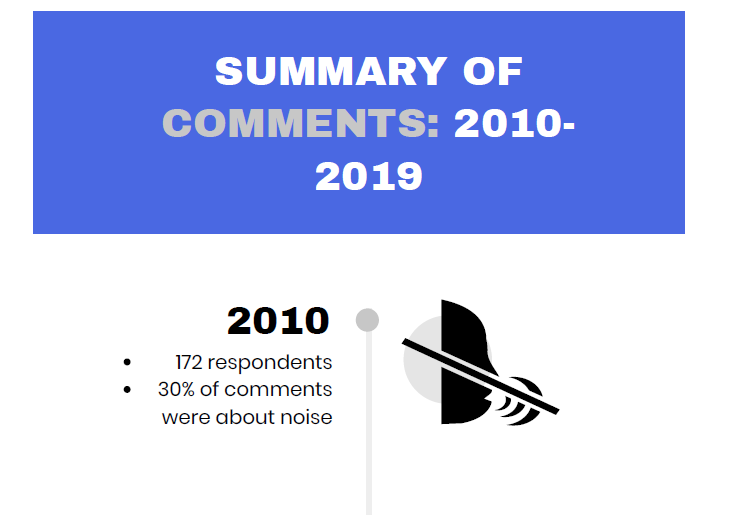
Summary of comments: 2010-2019
2010
- 172 respondents
- 30% of comments were about noise
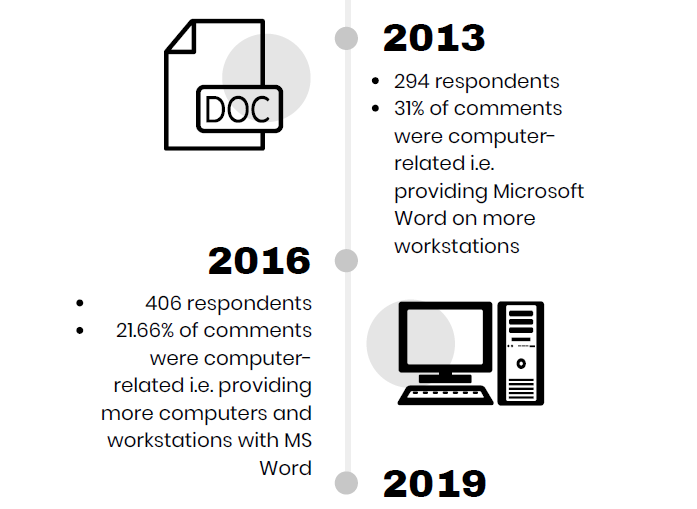
2013
- 294 respondents
- 31% of comments were computer-related i.e. providing Microsoft Word on more workstations
2016
- 406 respondents
- 21.66% of comments were computer-related i.e. providing more computers and workstations with MS Word
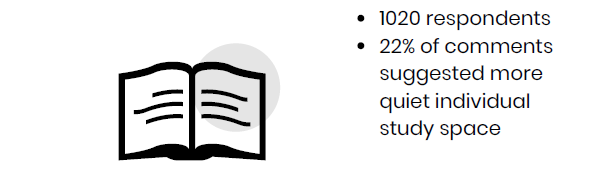
2019
- 1020 respondents
- 22% of comments suggested more quiet individual study space
- Karen Okamoto